PlatformAPM and tracing
Follow every request across every service.
Send traces with OpenTelemetry and see each service's throughput, errors and latency, the full path of a request, and the dependency that slowed it down.
What is application performance monitoring?
Application performance monitoring (APM) measures how your services behave for the requests that pass through them: how many requests they handle, how many fail and how long they take. Distributed tracing follows a single request across services, databases and external APIs, so you can see exactly where time went.
Televane builds APM on OpenTelemetry, the open standard for traces, metrics and logs. You instrument once, without a proprietary agent in your code, and get service health, trace waterfalls, a live service map and the database calls behind slow requests.
OpenTelemetry native
Instrument once with the open standard — OTLP over HTTP or gRPC.
- Service health — throughput, error rate and p95 latency for every service
- Trace view — the span waterfall with attributes and the logs of the same request
- Transaction names normalised automatically, for example /orders/123 becomes /orders/{id}
- Passwords, tokens and SQL literals masked before storage
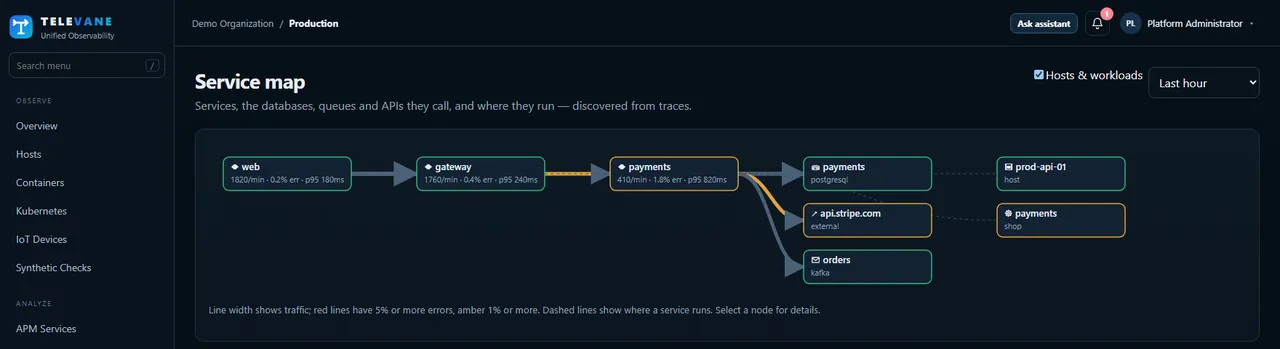
A live map of your system
Built from your traces — nothing to draw by hand.
- Services, databases, queues and external APIs, with the hosts and Kubernetes workloads behind them
- Calls per minute, error rate and p95 on every connection
- Database calls from your code — slowest statements, linked to their traces
Alert on what users feel
Rules and objectives on the numbers that matter.
- Error rate, p95, p99 and request-rate alerts per service or operation
- SLOs with burn-rate alerts
- Anomaly detection on request rate, errors and latency
Get started in three steps
- Create a free account — Sign up at portal.televane.com. The Free plan needs no card, and new organizations can try Pro free for 14 days.
- Point OpenTelemetry at Televane — Create an ingest token and set the OTLP endpoint and header in your OpenTelemetry SDK or Collector. No code changes beyond standard instrumentation.
- Explore and alert — Services, traces and metrics appear as data arrives. Add alert rules or SLOs on the numbers users feel.
Works together with
APM and tracing: common questions
Does Televane work with OpenTelemetry?
Yes. Televane is OpenTelemetry native: send traces, metrics and logs over OTLP via HTTP or gRPC, directly or through the OpenTelemetry Collector. No proprietary agent goes into your code.
Which languages can I trace?
Any language with an OpenTelemetry SDK, such as Java, .NET, Node.js, Python, Go and PHP.
Can I see which database query slowed a request?
Yes. Database calls appear in the trace, the service map shows every dependency, and the slowest statements link to their traces.
Try it on your own systems
Create a free account, install the agent with one command and see your data in minutes. 14-day Pro trial, no card needed.
Start free